Portfolio
Important Information
All the following report was developed in Power BI for a telecommunications company in Central America, with the goal of monitoring weekly sales and revenue. This report includes the total sales made by sales representatives and sales executives, as well as the analysis of data related to the behavior of general procedures by commercial zones, and technical area.
Additionally, it details the use of fiber optics network by areas and districts , both commercial and residential, providing key information for strategic decision-making.
It is important to note that this report is completely custom-made and is constantly evolving, adjusting to the changing needs of the company for almost 3 years. It is currently used by commercial zone directors, sales agency managers, and national management as a key tool for management and planning.
Clarification: All data presented in this report is fictitious, respecting the confidentiality of the company. Also, some visual elements, such as logos, have been omitted or replaced to preserve privacy and corporate identity.
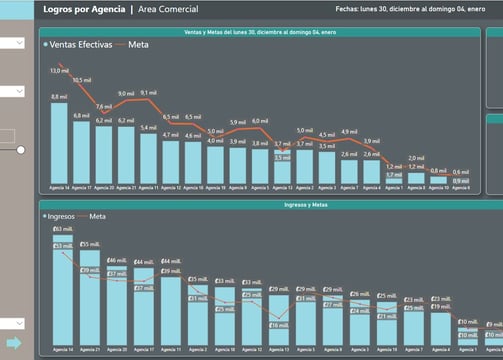
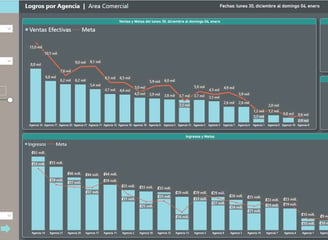
Sales by Agencies
This section displays sales and revenue data, compared with the established goals, broken down by sales points or agencies and week ranges.
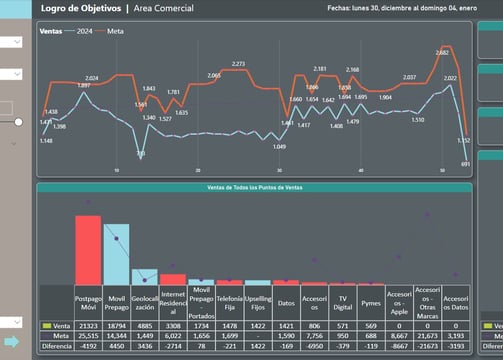
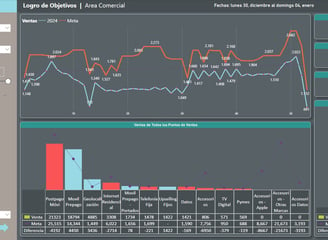

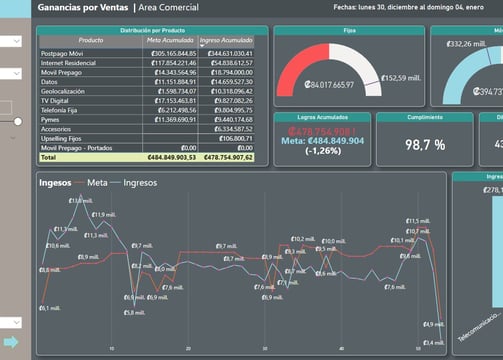
Achievement of Goals
This section shows the sales by product, compared with the established goals, including the percentage of goal fulfillment. The data can be viewed filtered by agencies and week ranges.
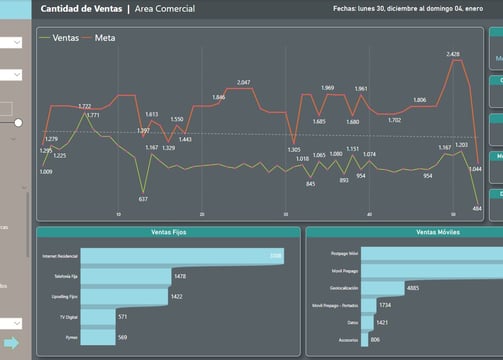
Sales Volume
This section presents the sales quantity by product, compared with the established goals, including the percentage of goal fulfillment. The data can be viewed filtered by agencies and week ranges.
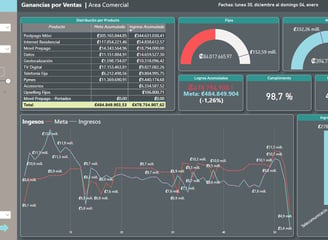
Click on the images...
Revenue from Sales
This section presents the revenue generated from sales during a selected period, filtered by week ranges. It is also possible to apply filters by agencies, products, service types, and agency types for a more detailed analysis.
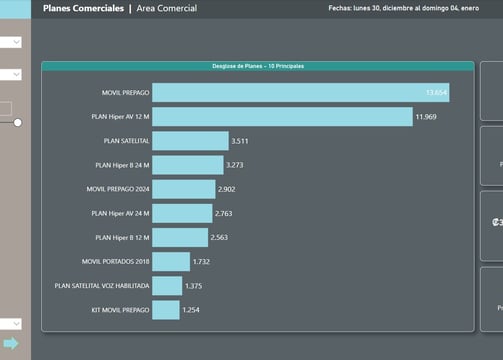
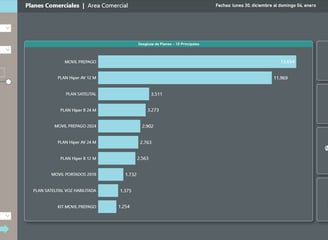
Marketed Plans
This section shows the sales quantity of service plans, covering both mobile and fixed services. It also details the revenue generated from these sales and the number of units sold.

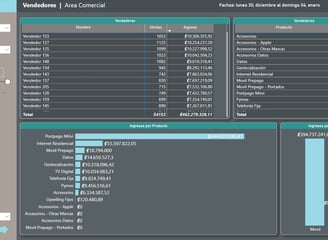
Sales by Representatives
This section details the sales made by each representative or salesperson from different agencies or stores, including a breakdown by product and the revenue generated from these sales.
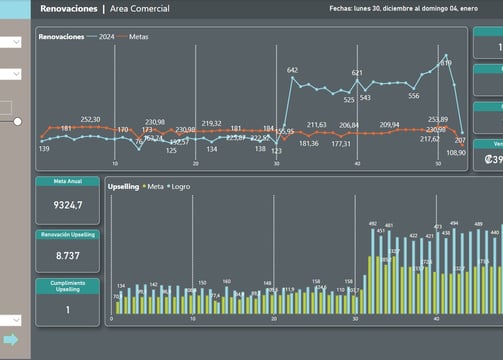
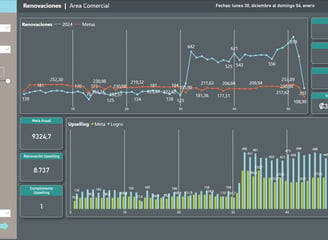
Service Renewal
In this section, data on re-contracting and renewing postpaid mobile services is presented, including upgrades to higher service plans.
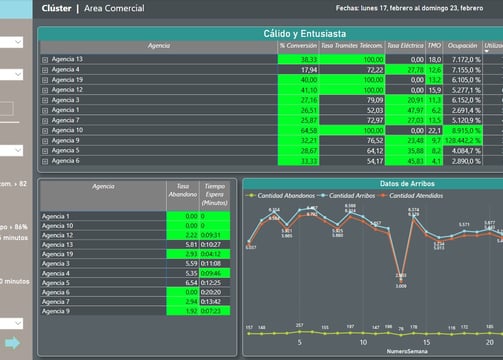
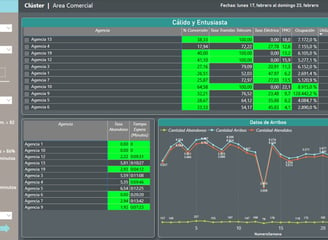
Indicators by Agencies
In this section, data on re-contracting and renewing postpaid mobile services is presented, including upgrades to higher service plans.
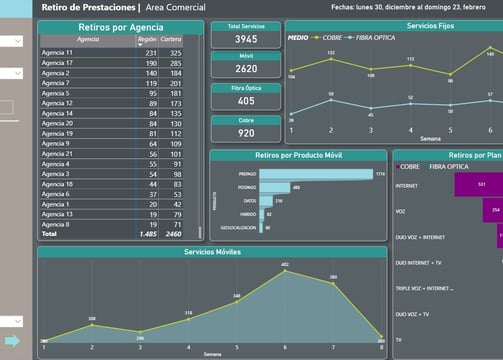
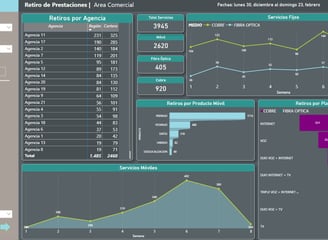
Service Withdrawals
This section details the accounting of service withdrawals, covering both fixed and mobile services, with the option to filter the data by agency and technology.
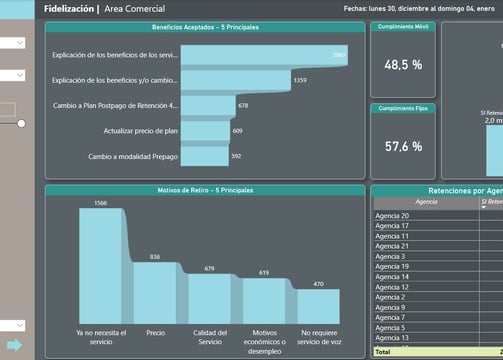
Fidelización de Clientes
En esta sección se presentan los datos relacionados con las políticas de retención y la fuga de clientes, incluyendo las razones por las que decidieron abandonar el servicio y las estrategias aplicadas para intentar retenerlos.
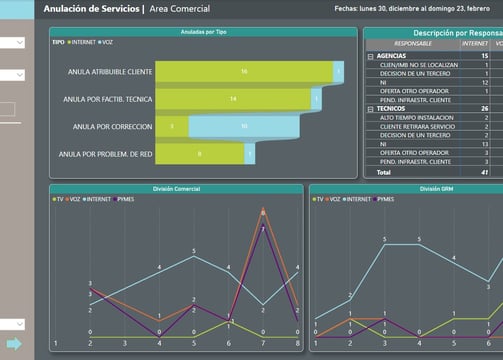
Cancelled Procedures
This section presents technical data on the cancellation of ongoing procedures within corporate systems, detailing the specific cause of the cancellation and the follow-up conducted by each agency.

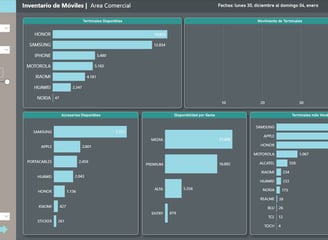
Inventory
This inventory details the available cell phones and accessories, with a cut-off date at the end of the current week. Additionally, it includes information on the best-selling cell phone brand.
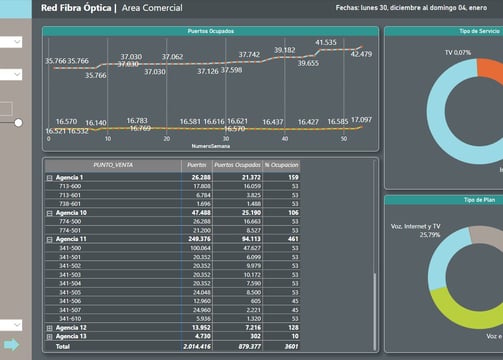
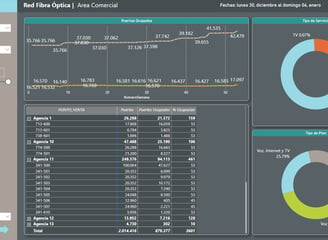
Utilization of the Fiber Optic Network
This section shows data on the occupancy of fiber optic ports in relation to the available ports, distributed by telecommunications centers, products, and current plans.